At the end of May Terra GIS is offering a 2 day class on QGIS Desktop GIS at the Impact HUB, Seattle, Washington. The class will focus on practical exercises in a workshop style setting. The class will enable ArcGIS users to easily transition to using QGIS and its comprehensive tool kit (or to use it in addition to their existing GIS software). Participants can choose to attend the full two day class or optionally attend only one of the two days. Details about the class can to be found here.
Search Results for: -bit.ly/docs/presentations//2008/11/24/obama-campaign-mapping-voters-with-mapserver-postgis-and-openlayers/www.toolserver.org/tiles/bw-mapnik/www.qgis.org//2008/11/24/obama-campaign-mapping-voters-with-mapserver-postgis-and-openlayers
Practical QGIS

Terra GIS is offering a three 3 day online class on QGIS Desktop GIS ( taught live from Seattle, Washington). The class will focus on practical exercises in a workshop style setting.
The class content has been designed for GIS users with at least an intermediate knowledge level in mind (as no GIS basics will be covered). It will also enable ArcGIS users to easily transition to using QGIS and its comprehensive tool kit (or to use it in addition to their existing GIS software). QGIS is a powerful desktop GIS system that is known for having a user-friendly interface, being able to access the most common data formats, both vector and raster ones. It features a wide range of tools for working with geographic information ( layout creation, analysis tools, geo-processing, model builder, etc.) and provides excellent cartography, spatial analysis tools, and a wide range of spatial database connectivity. Via the QGIS community a wide range of plug-ins that are extending the core functionality are available ( to the point that nearly everything you ever wished to use a GIS for seems to be possible). It is an open source project that is published under the GNU General Public License (GPL), which allows its free use, distribution, study and improvement.
In class participants will connect to the interactive online session (hosted via join.me) via a web browser and internet connection. For audio either one – native computer audio or alternatively local phone call-in lines can be used. In class we will use QGIS v. 3.14 (Pi) for the hands-on exercises which is available for Windows, Mac and Linux computer operating systems.
Topics of the class are as follows (time indications for individual class sections below are not exact but approximate time estimates to give an idea of the focus of the class):
| Day 1 – Monday December 7th | |||
| Overview and Foundations of QGIS |
~30 minutes | ||
| The QGIS project and it’s community | |||
| Technical Foundations of QGIS (Libraries GDAL, OGR, PROJ4 ) | |||
| Practical Introduction to QGIS and Basic Functionalities |
|||
| Installation (OSGeo4W vs. stand alone) |
~30 minutes | ||
| QGIS Basics and Interface Overview | ~1 hour | ||
| Supported Data Formats | |||
| Exploring and using vector and raster data | |||
| Layer + map properties | |||
| Best practices, using map templates | |||
| Customization and settings (user interface) | |||
| Exercises – Creating Maps | ~2.5 hours | ||
| Symbology / Cartography | |||
| Using layouts for cartography and printing maps | |||
| Working with tables and layers (editing features and attribute data, digitizing) |
|||
| Joining layers and tables | |||
| Exercises – Managing Raster Data | ~2 hours | ||
| Overviews, Virtual Raster Tables (VRT) | |||
| Raster calculator | |||
| Hill shade, slope, aspect (from DEM) | |||
| Day 2 – Tuesday December 8th (a working knowledge of the content covered on day one is a prerequisite to ‘feel at home’ on this day) |
|||
| Extended functionalities with QGIS – Overview and Exercises |
|||
| Map Layout and Atlas Creation | ~1.5 hours | ||
| Geospatial Processing Tools | ~2 hours | ||
| Spatial Analysis | |||
| Using the geo-processing tools and graphical model builder | |||
| Integration with external programs (Grass, R Statistical Software, SAGA GIS, Lidar tools etc.) |
|||
| QGIS Plug-ins – a short Overview e.g. |
~2 hours | ||
| Google/ Bing / Open Street map | |||
| Georeferencer | |||
| Topology | |||
| Semi Automatic Classification Plug-in (Remote sensing) | |||
| Python Scripts and Interface – Intro |
~30 minutes | ||
| QGIS User Resources | ~30 minutes | ||
| Day 3 – Wednesday December 9th (a working knowledge of the content covered on day one and two is a prerequisite to ‘feel at home’ on this day) |
|||
| Advanced functionalities with QGIS |
|||
| Using Layer ‘Actions’ to automate things |
~1 hour | ||
| Editing Layers | ~1.5 hours | ||
| Using defined value drop down menus (called domains in ArcGIS) |
|||
| Using custom interface dialogs | |||
| QGIS and Spatial Databases | ~2 hours | ||
| Connecting to PostGIS, Spatialite | |||
| Exporting/Importing data to/from spatial databases | |||
| Creating and using dynamic layers | |||
| Using Python and R (Statistics program) scripts |
~2 hours | ||
| Using Python to automate things | |||
| Connecting and using external resources (e.g. Google Earth Engine) |
|||
| Integrating R Scripts | |||
Instructor
The class will be presented by Karsten Vennemann who has over 12 years of experience with FOSS4G software and has lead numerous workshops in GIS throughout his 20+ years career in GIS.
Dates
First Day – Monday December 7th (8:30 am – 4:30 pm)
Second Day – Tuesday December 8th (8:30 am – 4:30 pm)
Third Day – Wednesday December 9th (8:30 am – 4:30 pm)
each day with one hour lunch break plus two 15 minute short breaks
Participants can choose to attend the full three day class or optionally attend only one or two of the three days. Day two and three builds on the topics covered on the previous day respectively. Please inquire about other potential class dates if you are interested but cant make the dates.
Class size
- minimum of 6, maximum of 16 participants
Costs
- single day (day one or two or three) US $325/per person
- 2 days US $595/per person
- 3 days US $750/per person
Location
Live Online Session, each day 8:30 am – 4:30 pm PST (UTC -7:00 hours )
For this class you will use your own computer
Guidelines about operating systems
Windows computers running on Win 7, 8 or 10. You will need administrative rights on the machine in order to install the QGIS software and plug-ins. Make sure to have a minimum of 5GB of disk space to copy the class materials onto your system. The file system of your laptop has to be NTFS (not FAT32). If you are planning to use a machine that doesn’t comply with these requirements please contact us and we can talk about whether your specific case will work out just fine for the class.
Mac computers – there might be some potential issues using QGIS on the newest versions of the Catalina operating system – e.g. Mac OS Catalina (10.15). Please make sure to contact the instructor prior to the class so these issues can be resolved .
Target Audience/Prerequisites
GIS Specialists/Analysts/Programmers – at least intermediate level as no GIS basics will be covered. This course is designed for GIS users who want to learn about effectively using QGIS as a desktop tool. ArcGIS users will feel at home as differences between ArcGIS and QGIS will be illustrated for those who are interested.
Registration
Please contact us via email (at info [at] terragis [dot] net to receive a registration form) if you like to register or call us at 206 905 1711 with additional questions.
Pre-conference workshop at 2014 NWGIS Conference
 Terra GIS is offering a 2 day hands-on pre-conference workshop at the 28th annual Northwest GIS Users Conference – WORKING ACROSS BORDERS. The conference this year will be held at the Lynnwood Convention Center, about 15 miles north of downtown Seattle, Washington. The pre-conference workshop will be held on Monday October 13th and Tuesday October 14th, 2014, the main conference program will continue until Friday of the same week. Details about the workshop are here and the official conference workshop pages/registration are here.
Talk at WAURISA 2014 in Tacoma

Today I gave a pretty general talk “Cartography and composition of interactive Maps“ at the WAURISA GIS 2014 conference in Tacoma. The talk is strongly based on Ian Muehlenhaus’s excellent book “Web Cartography. Map design for Interactive and Mobile devices” (2014). This years conference had a strong theme about communication which worked out really well and my presentation fit right in. The presentation slides are here.

Dynamic Web map of gvSIG CE downloads
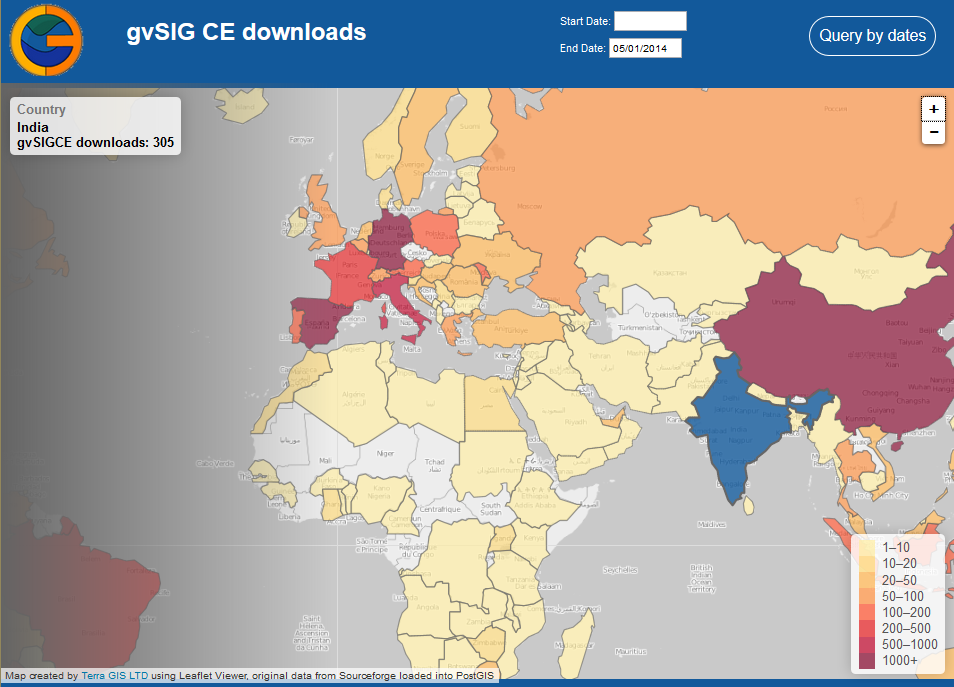 For some time I had been wishing to create an interactive web map showing downloads of gvSIG CE over time. This could provide a nice opportunity to learn more about using the Leaflet JS viewer, and dynamically outputting results as GeoJSON, while at the same time providing more detailed insight into the download dynamics of the gvSIG CE project over time. The idea was to create a map that provides for custom styling and has query capability of the download statistics by country and time intervals.
The software downloads of gvSIG CE are hosted on Sourceforge. Sourceforge also supplies an API for retrieving download statistics for any of their hosted projects – see . The technical steps taken to create the new gvSIG CE download map are as follows: On a server that already had a complete software stack of OS GIS web mapping components installed I created a new PostGIS data base. A simplified Countries (of the world) GIS layer was imported and additional tables to hold the gvSIG download data and summaries created.
Next a way to load the gvSIG CE download statistics into the PostGIS was needed. This was implemented via a custom Python script that can retrieve the data from the Sourceforge API ( automated via a server cron job ) on a daily basis. To obtain all existing data for each day the script had to run separate API calls for each day from the initial start of downloads on August 30 2011 up to today. The Python script then creates a temporary SQL file on the server file system that includes the SQL insert commands for creating the download records in the PostGIS table. Executing the SQL commands in the SQL file in the data base a separate record will be created in that table including the number of downloads for each country and day. For example if on a specific day there where one or multiple downloads from 4 countries then there would be 4 new records added having the countries names, and respective number of downloads along with the download date. Next the web page for the web map was created using a Leaflet based GIS viewer (a Java Script library). The simple Country layer in GeoJSON format was added to Leaflet and some nice, third party base map tiles (in gray scale from www.toolserver.org/tiles/bw-mapnik/ ) added to the map view. In PostGIS the download data was then summarized and joined to the Country geometries in a data base view. The contents of this data base view where exported as GeoJSON and saved as a static java script file and included as a layer in the Leaflet map.
The map at this stage showed the (static) total number of downloads for each Country from the start of downloads to today, however this did not include any query capability. To implement query capability some additional steps are needed: in the GUI two data selection HTML fields for start and end date where added along with a query button. When a user clicks the query button a PHP on the server will be called with the query dates. The query logic is a moderately complex SQL query that summarizes the download data for the selected time period, joins the results to the Country PostGIS layer geometries and then outputs the results as GeoJSON dynamically. Consequently for each query those countries that have had no downloads for the queried time period will not appear in colors in the GeoJSON result layer. In essence the dynamic query replaces the static java script file with the country geometries and total download statistics we added initially.
The draft map that resulted from this work can be found at http://gvsigce.terragis.net. At first glance the most interesting thing is that the top three countries are Spain followed by China and Germany in number of total downloads.
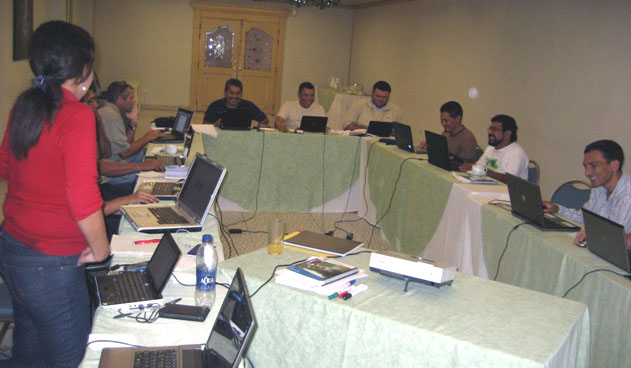
Trans-SEC Web GIS workshop in Morogoro, Tanzania

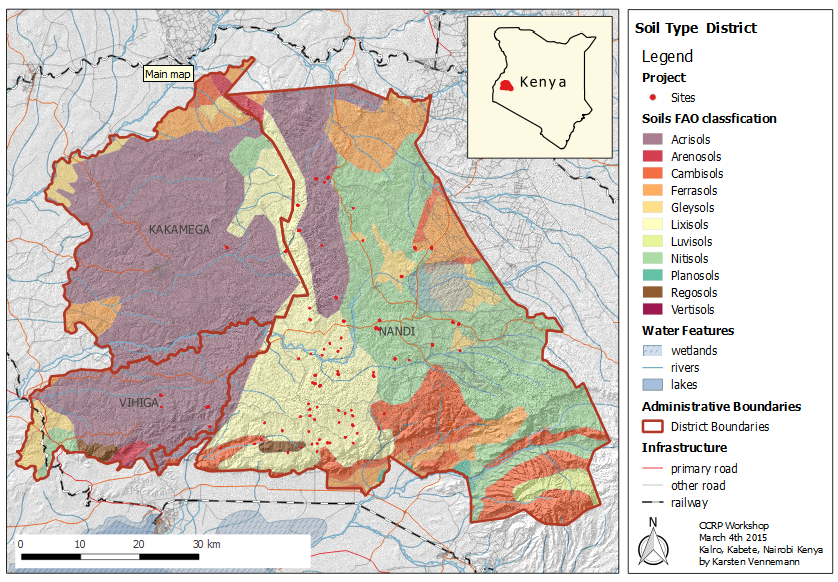
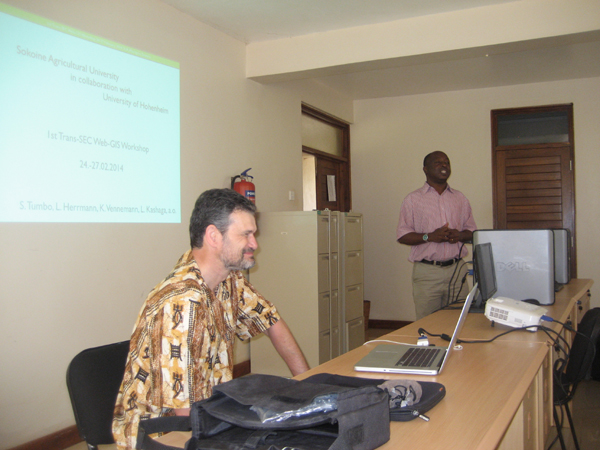
The Web GIS workshop was organized in a cooperation between Sokoine University of Agriculture (SUA), Tanzania and the University of Hohenheim, Germany. Last week my friend and fellow Soil Scientist Dr. Ludger Herrmann and me met at SUA in Morogoro, Tanzania to jointly lead this 3 day workshop for the Trans-SEC project working on food security in eastern Africa. Ludger had been my boss during my first job from 1998-2000 at the University of Hohenheim, Department of Soil Science and Land Evaluation, but we had not worked together professionally since then. 
The long name of Trans-SEC is Innovating Strategies to safeguard Food Security using Technology and Knowledge Transfer. Over the next 3 years I will work together with Ludger and our partners at SUA, a team of scientists lead by professor Siza Tumbo. My role will be to teach and support the team implementing a Web GIS platform (based on Open Source GIS software) for use in the Trans-Sec project and to publish an Atlas of Food security of Tanzania.
During this first workshop participants where introduced to MapServer, OpenLayers and PostGIS and we build some first temporary web maps together on a temporary web server. On the second last day of the workshop the server that was shipped from Hohenheim arrived in Morogoro by bus and was then installed on the last day of our stay at the computing center at SUA with help from the IT department. Ludger and I will return for two more web mapping workshops over the next two years to support the project and its mapping components.
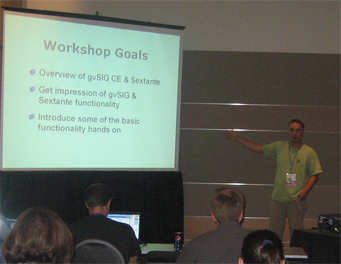
gvSIG CE and Sextante workshop at the 2012 WAURISA Conference
Introduction to gvSIG CE and geo-processing with SEXTANTE
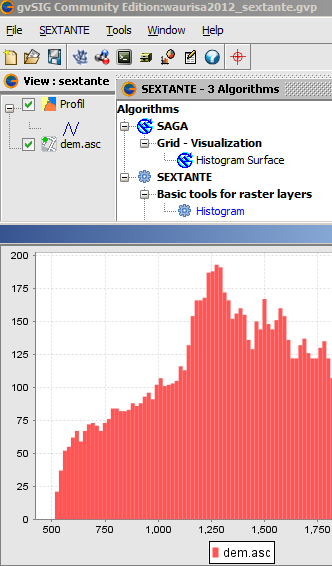
Terra GIS is offering a 4 hours introductory class/hands on workshop about gvSIG CE desktop GIS and Sextante at the WAURISA Conference in Tacoma on Monday May 7th, 2012, 1pm – 5pm.
gvSIG is a powerful desktop GIS system that is known for having a user-friendly interface, being able to access the most common data formats, both vector and raster ones. It features a wide range of tools for working with geographic information (query tools, layout creation, geo-processing, networks, model builder, etc.) and provides excellent cartography and spatial analysis tools, and a wide range of spatial database connectivity. gvSIG CE is the open and international version that has many extensions such Sextante (raster and vector analysis), Raster and Remote sensing, and Network analysis natively integrated.
Preparations and downloads for workshops participants:
Prior to the workshop please download and copy to your system the gvSIG CE software and the workshop data using the links below. Note that Java is needed to run gvSIG and Sextante and is included in the gvSIG CE download for Linux and Windows, but is a separate download for some Mac operating systems .
Update Monday May 7th:
Picture from the workshop at WAURISA:
More information: Please contact us via email or call 206 905 1711 if you have additional questions
Sextante everywhere
After the geo-processing library Sextante ![]() was made available for gvSIG, gvSIG CE, and for ArcGIS, a plugin for QGIS was released by Victor Olaya in cooperation with the QGIS community. Now the Sextante toolbox truly has the potential to become the most comprehensive and widely used GIS geo-processing tool that runs on almost any software platform and in almost any GIS software 🙂 . Congratulations Victor and QGIS community !
was made available for gvSIG, gvSIG CE, and for ArcGIS, a plugin for QGIS was released by Victor Olaya in cooperation with the QGIS community. Now the Sextante toolbox truly has the potential to become the most comprehensive and widely used GIS geo-processing tool that runs on almost any software platform and in almost any GIS software 🙂 . Congratulations Victor and QGIS community !
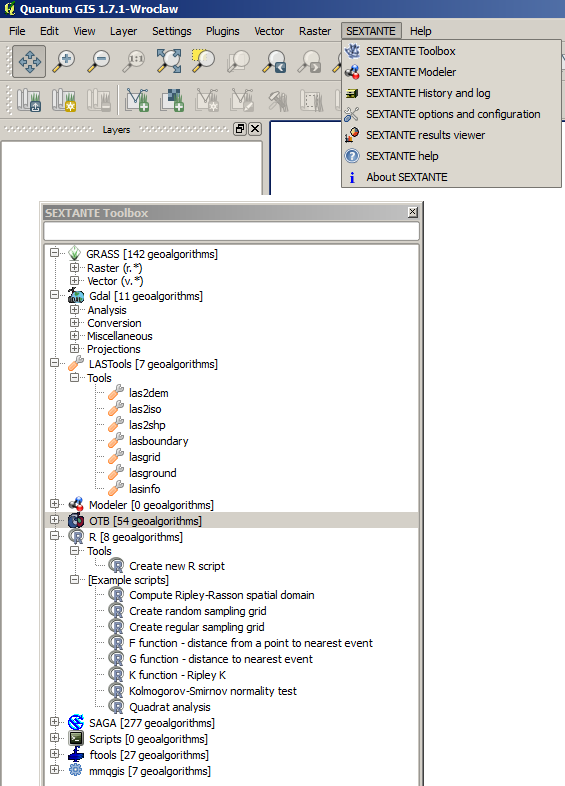
For the plugin a rewrite of Sextante algorithms in python is being developed and will take some time to be completed. Currently the Sextante toolbox in QGIS provides access to Grass, Gdal, LASTtools, Sextante Modeler, OTB tools, R, SAGA, fTools and mmqgis. Lots more to come in the next months !
SpatialKit and SEXTANTE for ArcGIS Desktop
In today’s presentation at King County GIS Center User Group meeting (Seattle, WA, USA) I talked about two powerful free & Open source extensions for ArcGIS. Both of them were released in late 2011: SpatialKit for ArcMap and SEXTANTE for ArcGIS. These extensions offer functionality that is not available at the ArcView level to ArcGIS license owners. This talk will present the extensions and demonstrate many of their tools.
 SpatialKit for ArcMap enables users to use PostGIS data directly in ArcGIS. This means that ArcGIS users can employ the power of the first-class, open source spatial database PostGIS in the same way they use proprietary databases to store, edit and retrieve spatial features via ArcSDE. SpatialKit for ArcMap does not require ArcSDE, ArcInfo, the new Spatial Data Server (SDS) technology, or ArcGIS server.
![]()
SEXTANTE is a spatial data analysis library written in Java. The SEXTANTE for ArcGIS extension makes it possible to use SEXTANTE (and SAGA GIS) tools directly in ArcGIS, including Model Builder. Together SEXTANTE and SAGA comprise hundreds of spatial analysis functions, including many that are otherwise available in ArcGIS only through proprietary extensions that require additional licenses, such as Spatial Analyst.
 gvSIG CE was presented as a powerful Desktop GIS and at the same time a great alternative to use Sextante integrated with the Grass, and Saga GIS algorithms (Grass algorithms are not available for the ArcGIS extensions at the time of writing). In the near future a version of Sextante will be released that in addition integrates the use of R (Statistical package) algorithms from within Sextante.
downloads
presentation slides (PDF)
zip archive with the 2 extension software packages , documentation and all (45 MB)
external links
Spatial Kit for ArcMap
SEXTANTE
SEXTANTE for ArcGIS
gvSIG CE
Micuenca project workshop – San Salvador
Terra GIS and Catholic Relief Services (CRS San Salvador office) joint forces for a three day long workshop to develop an interactive Web GIS for the GWI (Global water Initiative) Micuenca project (Integrated Watershed Management in Latin America).
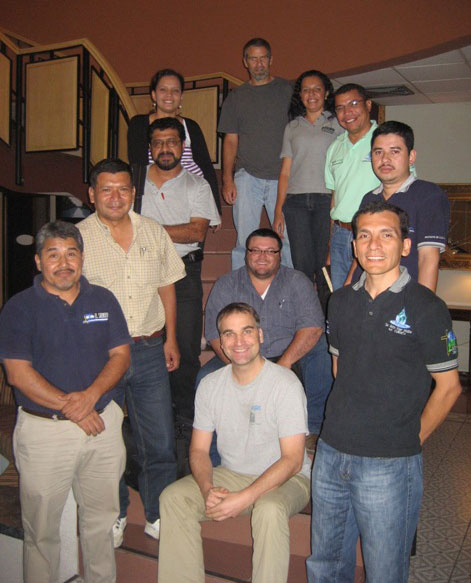
Project Coordinator Paul Hicks (CRS) , Norma Minero (CRS) and Karsten Vennemann (Terra GIS) jointly lead a workshop with participants from each of the 4 countries in the Micuenca project: Nicaragua, El Salvador, Guatemala and Honduras. Two representatives for each of the countries attended the workshop. As a group we jointly defined and started building the functionality of the Micuenca GIS Viewer. Finally all where working in small groups to assemble and edit data for use in the Web GIS and data base.