 For some time I had been wishing to create an interactive web map showing downloads of gvSIG CE over time. This could provide a nice opportunity to learn more about using the Leaflet JS viewer, and dynamically outputting results as GeoJSON, while at the same time providing more detailed insight into the download dynamics of the gvSIG CE project over time. The idea was to create a map that provides for custom styling and has query capability of the download statistics by country and time intervals.
The software downloads of gvSIG CE are hosted on Sourceforge. Sourceforge also supplies an API for retrieving download statistics for any of their hosted projects – see . The technical steps taken to create the new gvSIG CE download map are as follows: On a server that already had a complete software stack of OS GIS web mapping components installed I created a new PostGIS data base. A simplified Countries (of the world) GIS layer was imported and additional tables to hold the gvSIG download data and summaries created.
Next a way to load the gvSIG CE download statistics into the PostGIS was needed. This was implemented via a custom Python script that can retrieve the data from the Sourceforge API ( automated via a server cron job ) on a daily basis. To obtain all existing data for each day the script had to run separate API calls for each day from the initial start of downloads on August 30 2011 up to today. The Python script then creates a temporary SQL file on the server file system that includes the SQL insert commands for creating the download records in the PostGIS table. Executing the SQL commands in the SQL file in the data base a separate record will be created in that table including the number of downloads for each country and day. For example if on a specific day there where one or multiple downloads from 4 countries then there would be 4 new records added having the countries names, and respective number of downloads along with the download date. Next the web page for the web map was created using a Leaflet based GIS viewer (a Java Script library). The simple Country layer in GeoJSON format was added to Leaflet and some nice, third party base map tiles (in gray scale from www.toolserver.org/tiles/bw-mapnik/ ) added to the map view. In PostGIS the download data was then summarized and joined to the Country geometries in a data base view. The contents of this data base view where exported as GeoJSON and saved as a static java script file and included as a layer in the Leaflet map.
The map at this stage showed the (static) total number of downloads for each Country from the start of downloads to today, however this did not include any query capability. To implement query capability some additional steps are needed: in the GUI two data selection HTML fields for start and end date where added along with a query button. When a user clicks the query button a PHP on the server will be called with the query dates. The query logic is a moderately complex SQL query that summarizes the download data for the selected time period, joins the results to the Country PostGIS layer geometries and then outputs the results as GeoJSON dynamically. Consequently for each query those countries that have had no downloads for the queried time period will not appear in colors in the GeoJSON result layer. In essence the dynamic query replaces the static java script file with the country geometries and total download statistics we added initially.
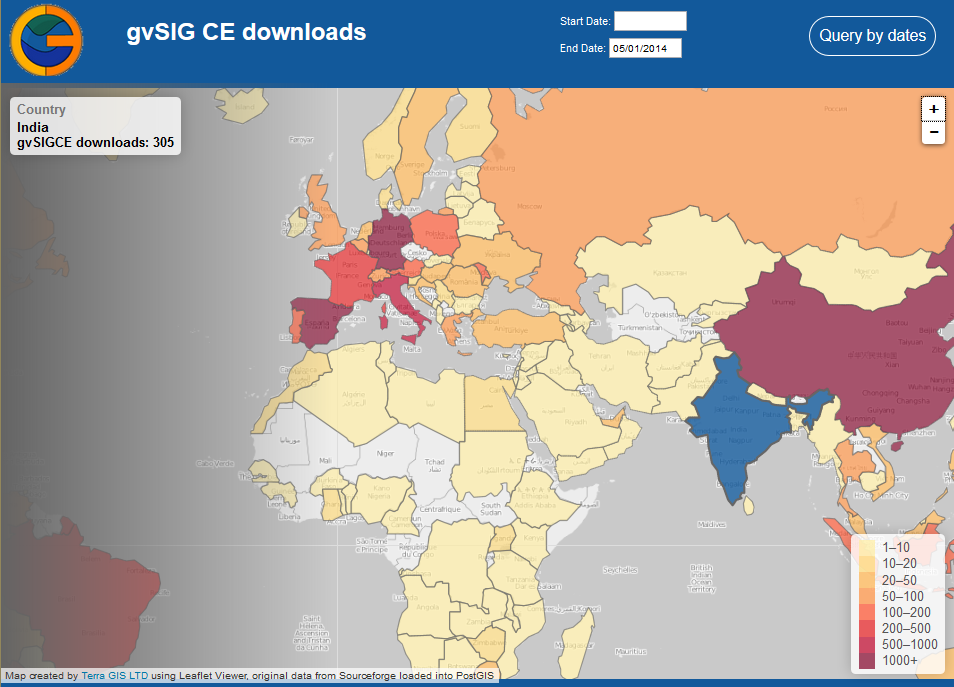
The draft map that resulted from this work can be found at http://gvsigce.terragis.net. At first glance the most interesting thing is that the top three countries are Spain followed by China and Germany in number of total downloads.
Terra GIS
Terrestrial Environment Regional Analysis
Built in (not always) sunny Seattle
Theme: Guten by Kaira